2 How balanced are two ‘Global Cities’?
Two double lessons, two homework activities.
Part A and B – Balance Criteria for Cities and Researching Balance in a City
In part 1, we learned about some of the ways in which a community (such as our school) can be judged to be balanced or not. We decided on suitable criteria to judge how balanced communities can be.
We are now going to think about how a whole city can be judged as balanced or not, in different ways.

Discuss (10 minutes)
Recap on some of the criteria which we discussed in Part 1, and decide whether any of these could also apply to a whole city.
What others should be added when comparing cities?
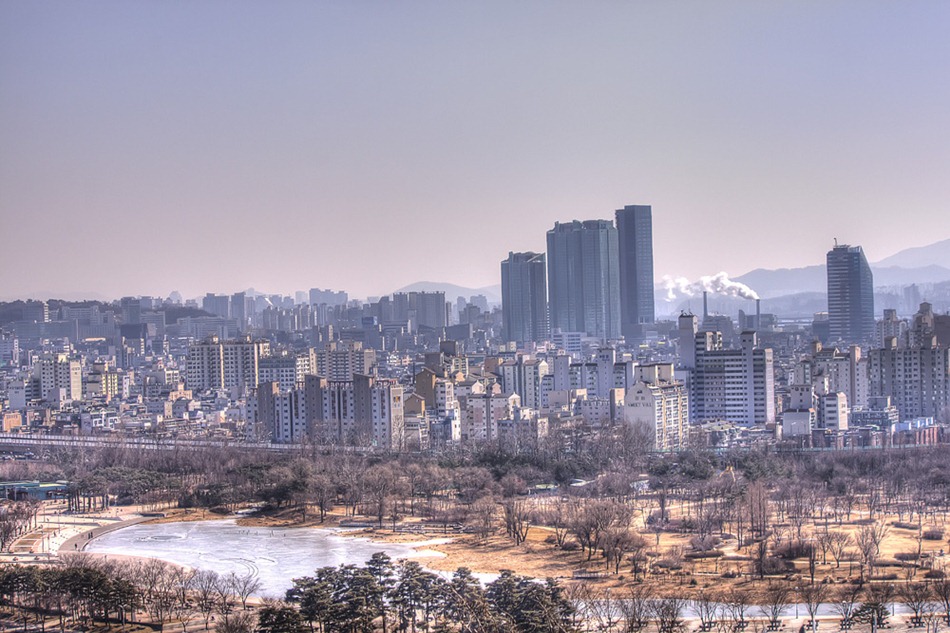
After you have discussed this, hover on the dots of the image below to get some ideas which we will be using for our next task.

Image: Some rights reserved by Jimmy McIntyre – Editor HDR One Magazine
 and
and 
How do two cities compare in how balanced they are as communities?
Activity: Group, work, research, making a poster (60 minutes)
The class should be divided into two groups, one to investigate London in the UK and the other group to investigate Mumbai in India.
A set of resources for London and Mumbai are given at the very bottom of this page.
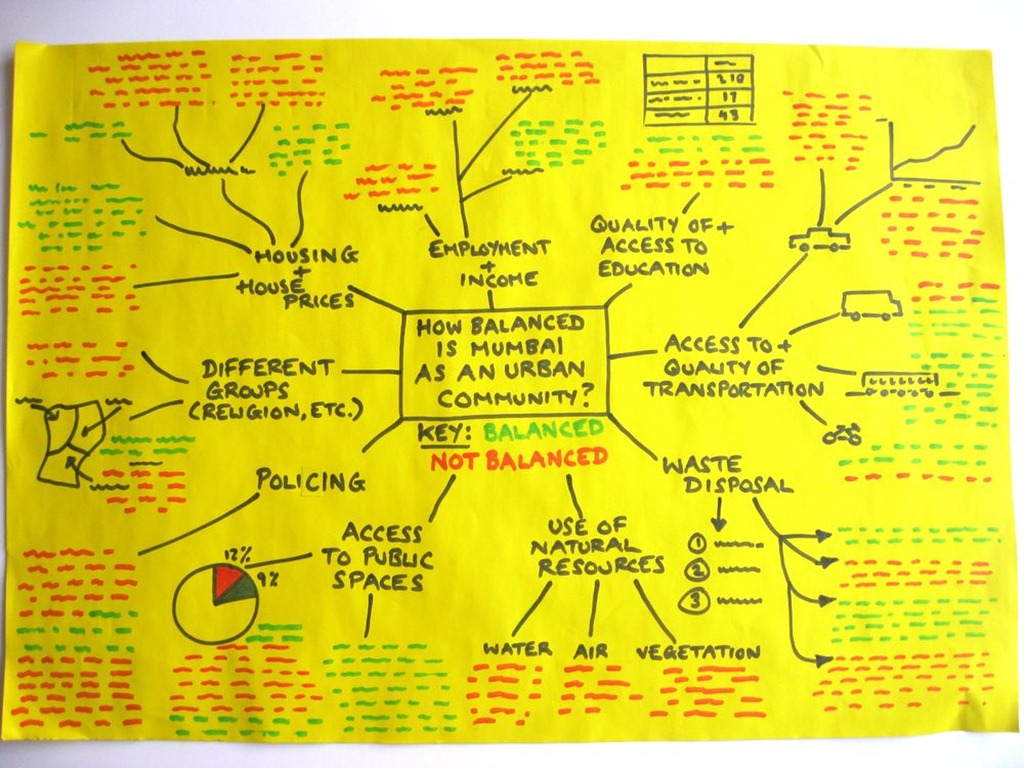
The groups will be subdivided further into groups of four. Each group will investigate the different elements of balance in these cities (e.g. public transport, police, quality of housing, racial divisions, waste disposal, etc.). Each smaller group will maker a poster, focusing on the particular city their larger group have been researching. You should make clear the balanced and unbalanced elements you think you have discovered and you should give the evidence (facts) for your conclusions.
It is very important that you select information from the resources carefully. You do not need to use all of the information, or all of the resources – you are just trying to show whether the city you are researching is balanced in different ways or not.
Here is a suggestion of how a poster might be organised – notice red notes are for things that are not balanced and green notes are balanced.

Homework after one double lesson – each person in the group should spend 30 minutes researching some information to add next lesson. Decide now who will research what.
Part C and D – Finishing the Poster, Sharing Your Research and Reflecting
Activity – Finish the Poster (40 minutes) The first thing you need to do is finish your poster in your groups.

Activity – share your findings with another group that studied the other city (20 minutes).
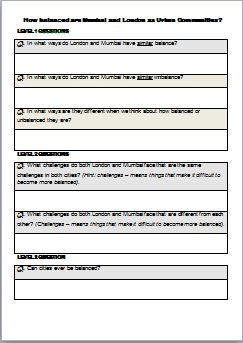
You each need to have a copy of a reflection sheet before we start the next activity. Click below if you need to download a copy.
You will need to complete the worksheet, and all of you should complete the Level 1 questions. Most of you should try the Level 2 questions and a few of you might try the Level 3 Question too. It is best to fill in the Level 1 questions when you discuss the posters with each other …
So, once the time is up for making the posters, half of your group (two people) will join half of another group (another two people). The other halves of these two groups will also join together. One poster (for London) will stay with one new group of four, and the other poster will stay with the other new group of four).
For 7 – 8 minutes the two who helped make the poster in front of them should explain in what ways the city is balanced and in what ways it is unbalanced. The other two should also ask questions – you want to understand how this city compares to the city you have just been researching. For example, is it more balanced? Or less balanced?
Then, swap the posters and the other two people in each new group of four will do the explaining.

Activity – Finish the worksheet (15 minutes) – try to answer the Level 2 questions, and maybe the Level 3 question too. This might need to be completed for homework.
Resources for London:
Easy: Video – A youtube clip introducing London, and some of its famous places
Medium: Video – A youtube clip of a BBC News report on inequality in London.
Medium: Video – A youtube clip – London luxury for the super-rich (by AlJazeera English).
Easy: Youtube clip. Someone (Daniel Raven-Ellison) takes a walk through London from one side to the other. Click here to see this interesting footage
Difficult: Article: London is the Developed World’s Most Unequal City, Says New Research (LondonNet)
Medium: Map – London’s Daytime Population by data.london.gov.uk
Medium: Map –The % of children in each of London’s boroughs (districts) who are poor.
Difficult: Map – London and ‘Economic Deprivation’ by http://undertheraedar.blogspot.com
Medium: Video – Excellent video on waste disposal in London (BBC – Britain From Above)
Difficult: map showing household incomes for each of London’s boroughs (districts)
Difficult: Fact sheet – Urban regeneration in East London
Difficult: London’s Poverty Profile – needs exploring
Help: If you find any good website resources on this topic yourself, please email the link to jape@patana.ac.th, and it could be added here.
Resources for Mumbai:
“No city I know, certainly not New York, has this variety of life, except perhaps London”.
Novelist Amit Chaudhuri on Mumbai (The Guardian, 2008) ![]()
Easy: – Eye on Mumbai – a few pages with some relevant information on Mumbai
Easy: Video – Squalid conditions in Mumbai slums (BBC Report)
Medium: explore life in a slum by the BBC – click on the different jobs at the top
Medium: some useful facts on this infographic (choose those that match the task)
Easy: Reflections on the rich youtube clip by CAPallfilms
Easy: Youtube clip: India rich and poor side by side by itdecisions
Easy: infographic about parked cars in Mumbai via archdaily.net
Medium: Youtube clip. Dharavi: The Heart of Mumbai – PREVIEW
Medium: Youtube clip: Mumbai’s Slums—the Real Scene Behind “Slumdog Millionaire”
Medium: Youtube clip: India’s huge volumes of waste
Medium: Article – In Mumbai, women campaign against unequal toilet access
Medium: Article – You have access to only 35% of the open spaces reserved in city for you (Hindustan Times)
Medium: Youtube clip: on Pollution and Waste in Mumbai
Easy: A map showing where Dharavi is (you can then compare this to the whole city by going onto Google Maps)
Easy: Youtube clip. Someone (Daniel Raven-Ellison) takes a walk through Mumbai from one side to the other.
Medium: A youtube clip on India’s rich poor divide challenge, featuring Mumbai
Difficult: Youths don’t view Mumbai as land of opportunity: Study (The Times of India)
Difficult: Land Use and Land Change – These pages by the SEOS project have some relevant information on Mumbai: pages 1, 2 and 3
Very Difficult Article: Mumbai is India’s city with the greatest inequalities (dnaindia.com)


This Post Has 0 Comments